

Sensor Calibration and Drift: When and How to Recalibrate
A pressure sensor that drifts ±0.55% of full scale over five years still passes a casual glance at the readout (ICS Schneider, 2026). That's the trap. Drift rarely announces itself - it creeps, and by the time someone notices, the batch is already made or the audit is already scheduled.
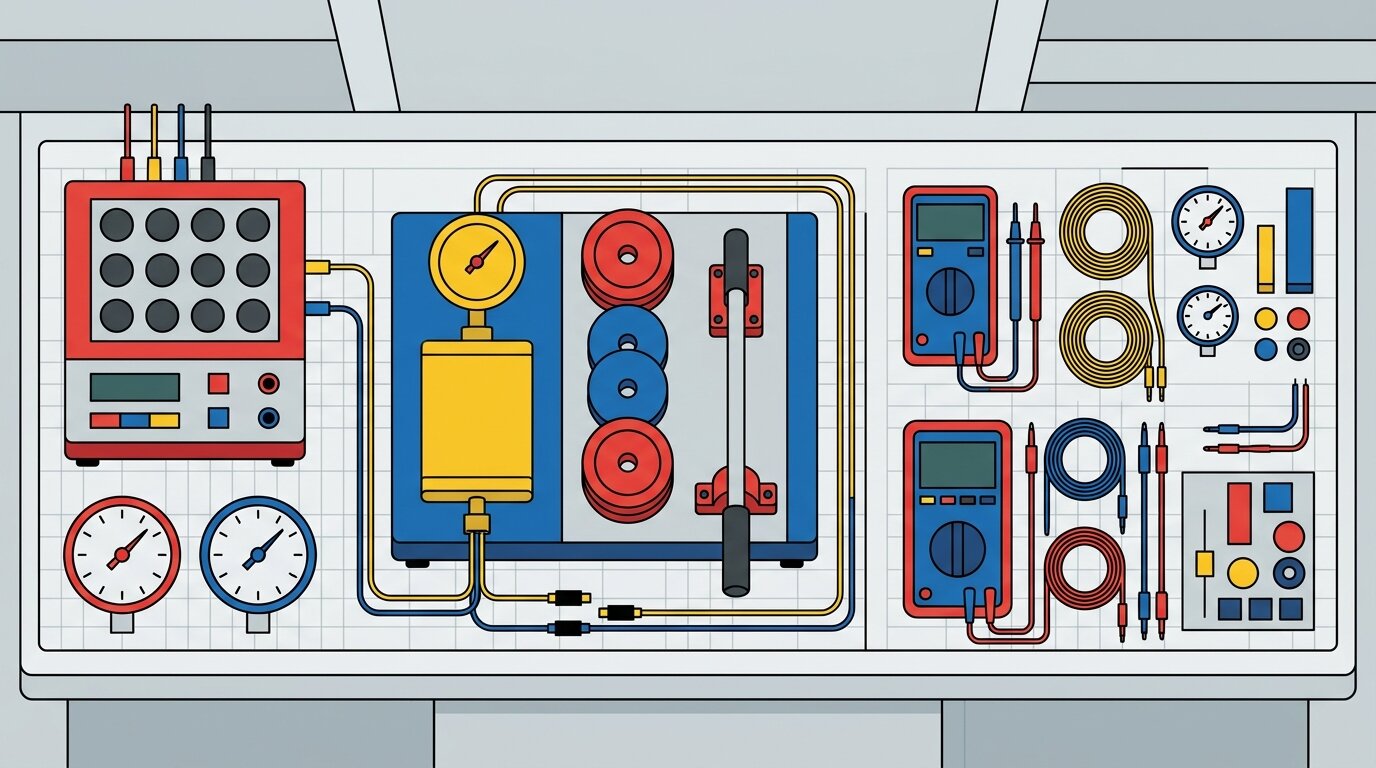 Verifying sensor output against a traceable reference is the starting point of any calibration check.
Sensor drift is the gradual change in a sensor's output for the same, unchanged input. A pressure transmitter or an RTD that read exactly right at commissioning will not read exactly right forever - the only question is how fast it moves and whether anyone is watching. This guide covers the four causes of drift, how to catch it before it costs you, and a formula for setting a calibration interval that fits your actual sensor and process instead of a generic schedule. It draws on the same measurement-chain thinking behind PT100 vs PT1000 and pressure sensor types.
TL;DR: Sensor drift is inevitable - thermal stress, aging, contamination, and mechanical wear all shift a sensor's output over time. RTDs drift about 0.1-0.5 C/year industrially; pressure transmitters drift about ±0.11%/year. Set your calibration interval from three inputs: historical drift rate, process tolerance, and environment, not a fixed schedule. A 4:1 test uncertainty ratio and NIST-traceable references make the certificate defensible.
What Is Sensor Drift, and Why Does It Matter?
Sensor drift is the gradual change in a sensor's output for an unchanged input, and it is measurable. Industrial RTDs typically drift ±0.1 to ±0.5 C per year (Schaevitz Industries, 2026), while precision RTDs can hold to 0.0025 C per year (Tempco, 2026). A sensor that read 100.0 at installation might read 100.4 eighteen months later, with nothing on the process side having changed at all.
That small a shift sounds harmless until it lands on the wrong side of a tolerance band. In food and pharma production, a temperature reading that's off by half a degree can mean a batch fails a hold-time or sterilization spec that nobody realizes was already compromised. In process control, drift erodes the safety margin an operator is relying on without any alarm ever firing, because the sensor itself never says it's wrong.
The cost asymmetry is the real argument for calibration discipline. A scheduled calibration check costs a technician an hour and a reference standard. An undetected drift event costs a rejected batch, a failed audit finding, or a safety incident traced back to a reading nobody questioned. Calibration is cheap insurance against a problem you cannot see coming any other way.
Citation capsule: Industrial RTDs drift roughly ±0.1 to ±0.5 C per year under normal operating conditions (Schaevitz Industries, 2026). Precision-grade RTDs, meanwhile, can hold stability to about 0.0025 C per year (Tempco, 2026). That range spans two full orders of magnitude, which is exactly why a single fixed calibration schedule can't fit every RTD in a plant - a precision sensor and a general-purpose one belong on very different intervals even though they look identical on a P&ID.
What Are the Four Main Causes of Sensor Drift?
Drift is not random noise; it follows four identifiable mechanisms, and each leaves a distinct signature in trend data. Thermal stress, aging, contamination, and mechanical wear all push a sensor's output in a particular direction. That's why trending - not just spot-checking - is the fastest way to diagnose which one is at work.
Thermal Stress and Cycling
Repeated temperature swings fatigue a sensor's internal structure and electronics, particularly in thermocouples and strain gauges. In nickel-based alloys like Type K, this shows up as an aging process that produces a positive EMF shift - the sensor reads artificially high. It typically appears when the element sits in a gradient between 370 and 540 C (NZ Measurement Standards Lab, TG39, 2026). Platinum-rhodium thermocouples (Types R and S) suffer a related effect: crystallographic ordering between 150 and 650 C shifts the Seebeck coefficient by about 0.2 to 0.5 C after 100 hours at 600 C. Fixed installations above 1100 C warrant recalibration after every 100 hours of continuous use (NZ Measurement Standards Lab, TG39, 2026).
Electronic and Material Aging
Semiconductors degrade, capacitors drift, and structural metals fatigue simply from time in service, independent of any single dramatic event. This is the slow, steady background drift you see in a long trend line even on a sensor that's never been abused - it's the reason "new" and "five years old" are not the same sensor even under identical conditions.
Contamination and Ingress
Moisture, corrosive gases, and particulate settle onto sensing elements and degrade their response over months. A pressure diaphragm exposed to a corrosive process gas, or an RTD probe in a humid enclosure, accumulates a slow offset that has nothing to do with the sensor's electronics and everything to do with what's touching it.
Mechanical Wear, Vibration, and Hysteresis
Vibration fatigues connectors and solder joints, and load cells specifically show two related but distinct behaviors: creep, a time-dependent drift in output under a constant sustained load (MH Force, 2026), and hysteresis, a directional offset where the same weight reads differently depending on whether the load was increasing or decreasing (Tacuna Systems, 2026). Neither is a defect - both are inherent to how a strain-gauge spring element behaves, which the load cells and strain gauges guide covers in more depth.
| Sensor type | Typical drift | Environment sensitivity | Interval range |
|---|---|---|---|
| RTD (industrial) | ±0.1 to ±0.5 C/year | Thermal stress and cycling accelerate aging | Annual default until drift history exists |
| RTD (precision) | ~0.0025 C/year | Low - stable even under normal cycling | Annual default until drift history exists |
| Thermocouple (Type R/S noble-metal, high temp) | Seebeck shift ~0.2-0.5 C after 100 hrs at 600 C | High - crystallographic ordering 150-650 C; sharp acceleration above 1100 C | Recalibrate every 100 hrs above 1100 C |
| Pressure transmitter (standard, outdoor or thermally cycled) | ~0.11%/year | High - environmental cycling accelerates drift | 1-4 years |
| Pressure transmitter (high-stability, indoor) | ~0.01%/year (Fuji Electric) | Low - stable indoor service | 4-6 years indoor, up to 10 years in stable service |
| Load cell | Creep (time-dependent) plus hysteresis under load | High - mechanical wear and vibration, not just electronic aging | Annual, maximum 2 years for stable light-duty applications |
Drift rate and environment sensitivity - not sensor age - are what should set the calibration interval.
Citation capsule: Sensor drift follows four mechanisms - thermal stress, aging, contamination, and mechanical wear - each with a distinct signature. Load cell creep is time-dependent drift under constant load (MH Force, 2026), while hysteresis is a directional offset where output differs between increasing and decreasing load (Tacuna Systems, 2026). Diagnosing which mechanism is active tells you whether the fix is re-terminating a connection, replacing a diaphragm, or simply recalibrating on schedule.
How Do You Detect Sensor Drift Before It Breaks You?
Four detection methods catch drift before it causes a failure: single-point checks against a reference standard, historical trending, parallel comparison against a matched sensor, and spec-sheet cross-referencing against elapsed service hours. None of them requires guessing - they all rely on data you already have or can cheaply collect.
Compare Against a Reference Standard
A single-point drift check compares the sensor's output to a traceable reference at one known input value. It's fast and it catches gross offset error, though it won't reveal span drift on its own. Historical trending plots readings over months or years instead. A rising or falling line, even a slow one, is the clearest early warning a plant can get. It works even without a reference standard on hand.
Running two identical sensors in parallel is a cheap diagnostic when one is suspect. Two RTDs measuring the same process should track within a tight band. Divergence tells you one of them is drifting, even before you know which one. Finally, cross-checking the manufacturer's published drift curve against actual elapsed operating hours and temperature exposure gives a predictive estimate before you ever pull the sensor for a physical check.
Citation capsule: Trending measurements over time catches drift long before a single spot-check would, because a slow, steady shift in the same direction is the signature of drift rather than noise. Running a suspect sensor in parallel with a known-good matched unit isolates which sensor is at fault without needing a calibration lab on standby - a practical field technique when a full reference-standard check isn't immediately available.
A Field Case: The 0.8 C Batch Reject
A food production line I worked with rejected a full batch because a temperature sensor had drifted about 0.8 C - the reading still looked "in tolerance" on the panel, but a downstream check flagged the product as out of spec. The sensor had gone unchecked for roughly 18 months, drifting at a measured rate of about 0.5 C per year, well within its published RTD spec but well outside what the process could tolerate over that stretch of time.
The fix wasn't a tighter sensor spec. It was a process change: six-month interval drift-trend checks, and recalculating the full calibration interval from the sensor's own historical drift data instead of a generic annual assumption. That single change eliminated the false-reject losses and made the audit file defensible, because every calibration decision now traced back to actual measured drift rather than a calendar guess.
The lesson generalizes past food and pharma. Wait for the calendar, or wait for a regulation to force your hand, and you will find out about drift after it has already cost you something.
What Is the Difference Between Zero Drift and Span Drift?
Zero drift and span drift are the two failure patterns behind almost every out-of-calibration sensor, and they need opposite fixes. Zero drift shifts the whole output by a constant offset, while span drift changes the scaling factor so error grows with the reading. Telling them apart before you recalibrate saves a wasted trip and a wrong adjustment.
Zero Drift: The Offset Error
Zero drift means the sensor reads a consistent amount too high or too low across its entire range - if it's 0.5 units off at the low end, it's 0.5 units off at the high end too. The sensitivity hasn't changed; the whole curve has simply shifted up or down. A single-point zero adjustment against a reference at one known value usually corrects it.
Span Drift: The Sensitivity Error
Span drift means the sensor's scaling factor itself has changed - it might read correctly near zero but increasingly wrong as the input rises, or vice versa. This is the drift pattern a two-point or multi-point calibration is built to catch, because a single-point check at one end of the range can miss it entirely. Span drift is common in load cells subject to creep and in pressure transmitters where diaphragm stiffness changes with age.
Citation capsule: Zero drift is a constant offset across the full measurement range; span drift is a change in sensitivity, so the error scales with the reading itself. A single-point calibration check can confirm zero drift but will not reliably catch span drift, which is exactly why two-point calibration - checking both a low and a high reference - is the industrial default rather than an optional extra.
What Calibration Methods Should You Use: Single-Point, Two-Point, Multi-Point, or Loop?
Calibration method should match the sensor's criticality and the drift pattern you're guarding against: single-point for low-stakes zero checks, two-point as the industrial default that catches both offset and span error, multi-point for high-precision or nonlinear sensors, and loop calibration when the whole measurement chain - not just the sensor - needs verifying.
Single-Point Calibration
A single-point check verifies the sensor against one reference value, usually zero. It's fast, cheap, and appropriate for low-criticality sensors where a rough confirmation is enough. It will not catch span drift, so treat it as a screening check rather than a full calibration.
Two-Point Calibration
Two-point calibration checks a low reference (often zero) and a high reference near the top of the operating range. This is the most common industrial method because it catches both zero drift and span drift in a single pass, which is why it's the practical default for RTDs, pressure transmitters, and most process sensors.
Multi-Point Calibration
Multi-point calibration uses three or more reference points spread across the full range. It's reserved for high-precision instruments, nonlinear sensors, or safety-critical applications where a straight-line assumption between two points isn't good enough to characterize the actual response curve.
Loop Calibration
Loop calibration verifies the entire measurement chain together - transmitter, wiring, controller input card, and display - rather than testing the sensor alone. A sensor can calibrate perfectly in isolation and still feed a wrong number to the control system if the 4-20mA signal path or the input card has its own error. Loop calibration is the only method that catches that class of problem.
| Method | What it does | Best for |
|---|---|---|
| Single-point | Verifies the sensor against one reference value, usually zero | Low-criticality sensors needing a quick screening check; catches zero drift but not span drift |
| Two-point | Checks a low reference (often zero) and a high reference near the top of the range | RTDs, pressure transmitters, and most process sensors as the industrial default - catches both zero drift and span drift |
| Multi-point | Uses three or more reference points spread across the full range | High-precision, nonlinear, or safety-critical sensors where a straight-line assumption between two points isn't good enough |
| Loop | Verifies the entire measurement chain - transmitter, wiring, input card, display | Process-critical loops, since a perfectly calibrated sensor can still feed a wrong number if another link in the chain has drifted |
Two-point calibration is the industrial default; loop calibration is the only method that catches errors outside the sensor itself.
Citation capsule: Two-point calibration - a zero check plus one high reference point - is the industrial default because it catches both offset and sensitivity error in a single test, while single-point calibration only confirms zero. Loop calibration goes a step further by verifying the transmitter, wiring, and display together, since a perfectly calibrated sensor can still feed a wrong number downstream if any other link in that chain has drifted.
How Do You Set Your Calibration Interval? (The Formula)
The right calibration interval comes from a calculation, not a fixed schedule: divide your process tolerance by the sensor's measured annual drift rate. A sensor drifting ±0.1 units/year against a ±0.5 unit process tolerance has a maximum safe interval of roughly five years - a completely different answer than a generic "calibrate annually" rule would give.
Calibration Interval ~ Process Tolerance / Annual Drift Rate
For example: a standard-grade pressure transmitter drifts about 0.11%/year (ICS Schneider, 2026). Against a ±0.5% process tolerance, dividing gives a maximum safe interval of roughly 4.5 years. That is why standard-grade transmitters in outdoor or thermally cycled service typically land in the 1-4 year range once environmental stress is factored in. A high-stability transmitter runs a drift rate roughly ten times lower, about ±0.01%/year (Fuji Electric, 2026), and that lower drift rate - not the same formula stretched further - is what earns the longer 4-6 year indoor interval and up to 10 years in stable service.
Adjust the calculated interval down by roughly half for harsh environments, aggressive duty cycles, or regulatory conservatism where a false-accept is expensive. Adjust it up only when you have several calibration cycles of proven low drift on record for that specific sensor in that specific environment - never on a hunch. If no drift history exists yet, annual calibration is the safe starting default until you've built the data to calculate a real number.
Load cells and force sensors follow the same logic but land on tighter numbers in practice: industry guidance recommends annual recalibration, with a maximum of two years for stable, light-duty applications (Tacuna Systems, 2026). That's tighter than a typical indoor pressure transmitter because mechanical creep and hysteresis - not just electronic aging - are actively working against the reading.
Citation capsule: Calibration interval is a calculation - process tolerance divided by measured annual drift rate - not an arbitrary fixed schedule. High-stability pressure transmitters can run 4-6 years indoors and up to 10 years in stable service, while outdoor installations need recalibration every 1-4 years because environmental cycling accelerates drift (Fuji Electric, 2026). The formula, not the calendar, is what should set the number.
What Is the 4:1 Test Uncertainty Ratio, and Why Does Traceability Matter?
A 4:1 Test Uncertainty Ratio means the reference standard used to calibrate a sensor must carry at least four times less measurement uncertainty than the device under test. This keeps the reference itself from becoming a source of error in the calibration. Without that margin, you can't tell whether a borderline reading reflects the sensor drifting or the reference standard being imprecise.
The 4:1 rule matters most at the margins. Every measurement carries an "indeterminate zone" - the range where the reading plus or minus its uncertainty makes a pass/fail call genuinely ambiguous. A wider TUR shrinks that zone; a narrower one forces a lab to widen its guardband and reject more borderline results just to stay conservative (Transcat, 2026).
Metrological traceability is what makes a calibration certificate defensible in an audit. It requires a documented, unbroken chain of comparisons connecting the field sensor back to NIST or another national metrology institute, with a stated measurement uncertainty at every single link in the chain. A NIST number on a certificate alone does not prove traceability - the documentation of the chain is what counts (NIST GMP 13, 2026). ISO/IEC 17025 accreditation certifies that a calibration laboratory maintains exactly that unbroken, documented chain.
 Uncorrected drift compounds gauge by gauge - the case for trending, not guessing, at the calibration interval.
Citation capsule: A 4:1 Test Uncertainty Ratio requires a calibration reference to be at least four times more accurate than the instrument under test, which shrinks the indeterminate zone where a pass/fail decision becomes genuinely ambiguous (Transcat, 2026). Metrological traceability adds a second requirement on top: a fully documented, unbroken chain of comparisons back to NIST or an equivalent body, with stated uncertainty at every step - a NIST test number alone, without that documentation, does not establish traceability (NIST GMP 13, 2026).
What Does a Practical Calibration Program Look Like?
A working calibration program runs on four habits: a documented interval worksheet per sensor, a method assigned by risk class, a logged result after every check, and a clear retire-versus-recalibrate rule. None of these require special software - a spreadsheet with discipline behind it beats an undocumented "someone probably checked it" assumption every time.
Maintain an interval worksheet per sensor listing type, measured annual drift from history, process tolerance, the calculated interval, the calibration method, and the next due date. Document which method - single-point, two-point, multi-point, or loop - applies to each sensor class, and assign a named person responsible for executing it on schedule, not a vague departmental owner.
Log every result: date, method used, before-and-after values, the reference standard's identifier, and the lab certificate number if the work went to an accredited lab. That log is what turns "we calibrate our sensors" into "here is the documented drift history for this specific sensor," which is the difference between passing and failing an audit finding.
Finally, decide retire versus recalibrate with a simple rule: if measured drift exceeds the sensor's stated tolerance, retire it rather than trust a one-time correction. If drift is within tolerance and the repair or recalibration cost is meaningfully below replacement cost, recalibrate and keep going. Applying this consistently, sensor type by sensor type, is what separates a calibration program from a pile of stickers on equipment. For how these sensor technologies compare across a plant floor in the first place, see the complete industrial sensors guide.
Citation capsule: A defensible calibration program logs the calibration method, before-and-after values, reference standard identifier, and lab certificate for every check - not just a due-date sticker on the sensor. That log is what an auditor actually wants to see, and it's the only way to calculate a real drift rate for the interval formula instead of guessing at one.
Frequently Asked Questions
How often should I calibrate sensors?
It depends on drift rate and process tolerance, not a fixed schedule. Use Interval = Process Tolerance / Annual Drift Rate. Without drift history, annual calibration is a common safe default in industry practice; Fuji Electric's own guidance for pressure transmitters spans a wider 1-10 year range once real drift data exists.
What causes sensor drift?
Four main causes: thermal stress and cycling, electronic and material aging, contamination or moisture ingress, and mechanical wear including vibration and hysteresis. Each leaves a different signature in the trend data.
How do I detect if a sensor is out of calibration?
Compare its output to a traceable reference standard, trend the readings over months for a rising or falling pattern, run it in parallel with a known-good sensor, or check the manufacturer drift specification against elapsed service hours.
What is the difference between zero drift and span drift?
Zero drift is an offset error - the sensor reads consistently high or low across the whole range. Span drift is a sensitivity error - the scaling factor has shifted, so error grows with the reading. They need different fixes.
When should I use two-point calibration vs multi-point?
Two-point calibration (zero and one high reference) is standard for most industrial sensors and catches both offset and span error. Multi-point (3+ references) is reserved for high-precision, high-criticality, or nonlinear sensors.
Conclusion
Sensor drift is not a defect - it's physics working on every RTD, thermocouple, pressure transmitter, and load cell in your plant, all the time. The plants that avoid drift-related batch rejects and failed audits aren't the ones with the newest sensors. They're the ones that trend drift, calculate their interval from Tolerance / Annual Drift Rate instead of a calendar, and keep a defensible NIST-traceable record behind every certificate.
Start with your highest-risk loops: the RTDs, thermocouples, and pressure transmitters feeding a safety or quality decision. Pull their drift history, run the formula, and set an interval that fits the sensor you actually have installed. That single change - measuring drift instead of guessing at it - is usually enough to stop the next unexplained batch reject before it happens.
Drift that pushes a sensor outside its rated accuracy matters even more when that loop feeds a safety function, since a SIL-rated device's proof-test interval assumes the sensor still performs to spec; see our SIL vs Performance Level guide for how calibration and proof testing fit into a device's safety integrity rating.
How often should I calibrate sensors?
It depends on drift rate and process tolerance, not a fixed schedule. Use Interval = Process Tolerance / Annual Drift Rate. Without drift history, annual calibration is a common safe default in industry practice; Fuji Electric's own guidance for pressure transmitters spans a wider 1-10 year range once real drift data exists.
What causes sensor drift?
Four main causes: thermal stress and cycling, electronic and material aging, contamination or moisture ingress, and mechanical wear including vibration and hysteresis. Each leaves a different signature in the trend data.
How do I detect if a sensor is out of calibration?
Compare its output to a traceable reference standard, trend the readings over months for a rising or falling pattern, run it in parallel with a known-good sensor, or check the manufacturer drift specification against elapsed service hours.
What is the difference between zero drift and span drift?
Zero drift is an offset error - the sensor reads consistently high or low across the whole range. Span drift is a sensitivity error - the scaling factor has shifted, so error grows with the reading. They need different fixes.
When should I use two-point calibration vs multi-point?
Two-point calibration (zero and one high reference) is standard for most industrial sensors and catches both offset and span error. Multi-point (3+ references) is reserved for high-precision, high-criticality, or nonlinear sensors.
Related Articles

